
Global E-Commerce Analysis
Excel | Python | SQL | Power BI
Interactive Power BI Dashboard:
Why this project?
I built this project to simulate how a modern business tracks financial health and catches operational mistakes. When looking at raw sales data, it's easy to see total revenue, but much harder to see where money is slipping through the cracks. This project builds a complete data pipeline to calculate true profit margins and pinpoint exactly where the business is losing money across a variety of possible sources.


Methodology
Dataset Aquisition: Dataset was aquired form Kaggle, a free open source data provider. This particular dataset was not a real-world dataset, but was designed to look and feel like one, simulating various formatting and data normalisation issues which are common place in real world datasets. Click here to see dataset.
Data Cleaning (Python): Used Pandas to import, clean, and format the raw, messy e-commerce datasets to ensure consistent dates, numeric values, and column structures.
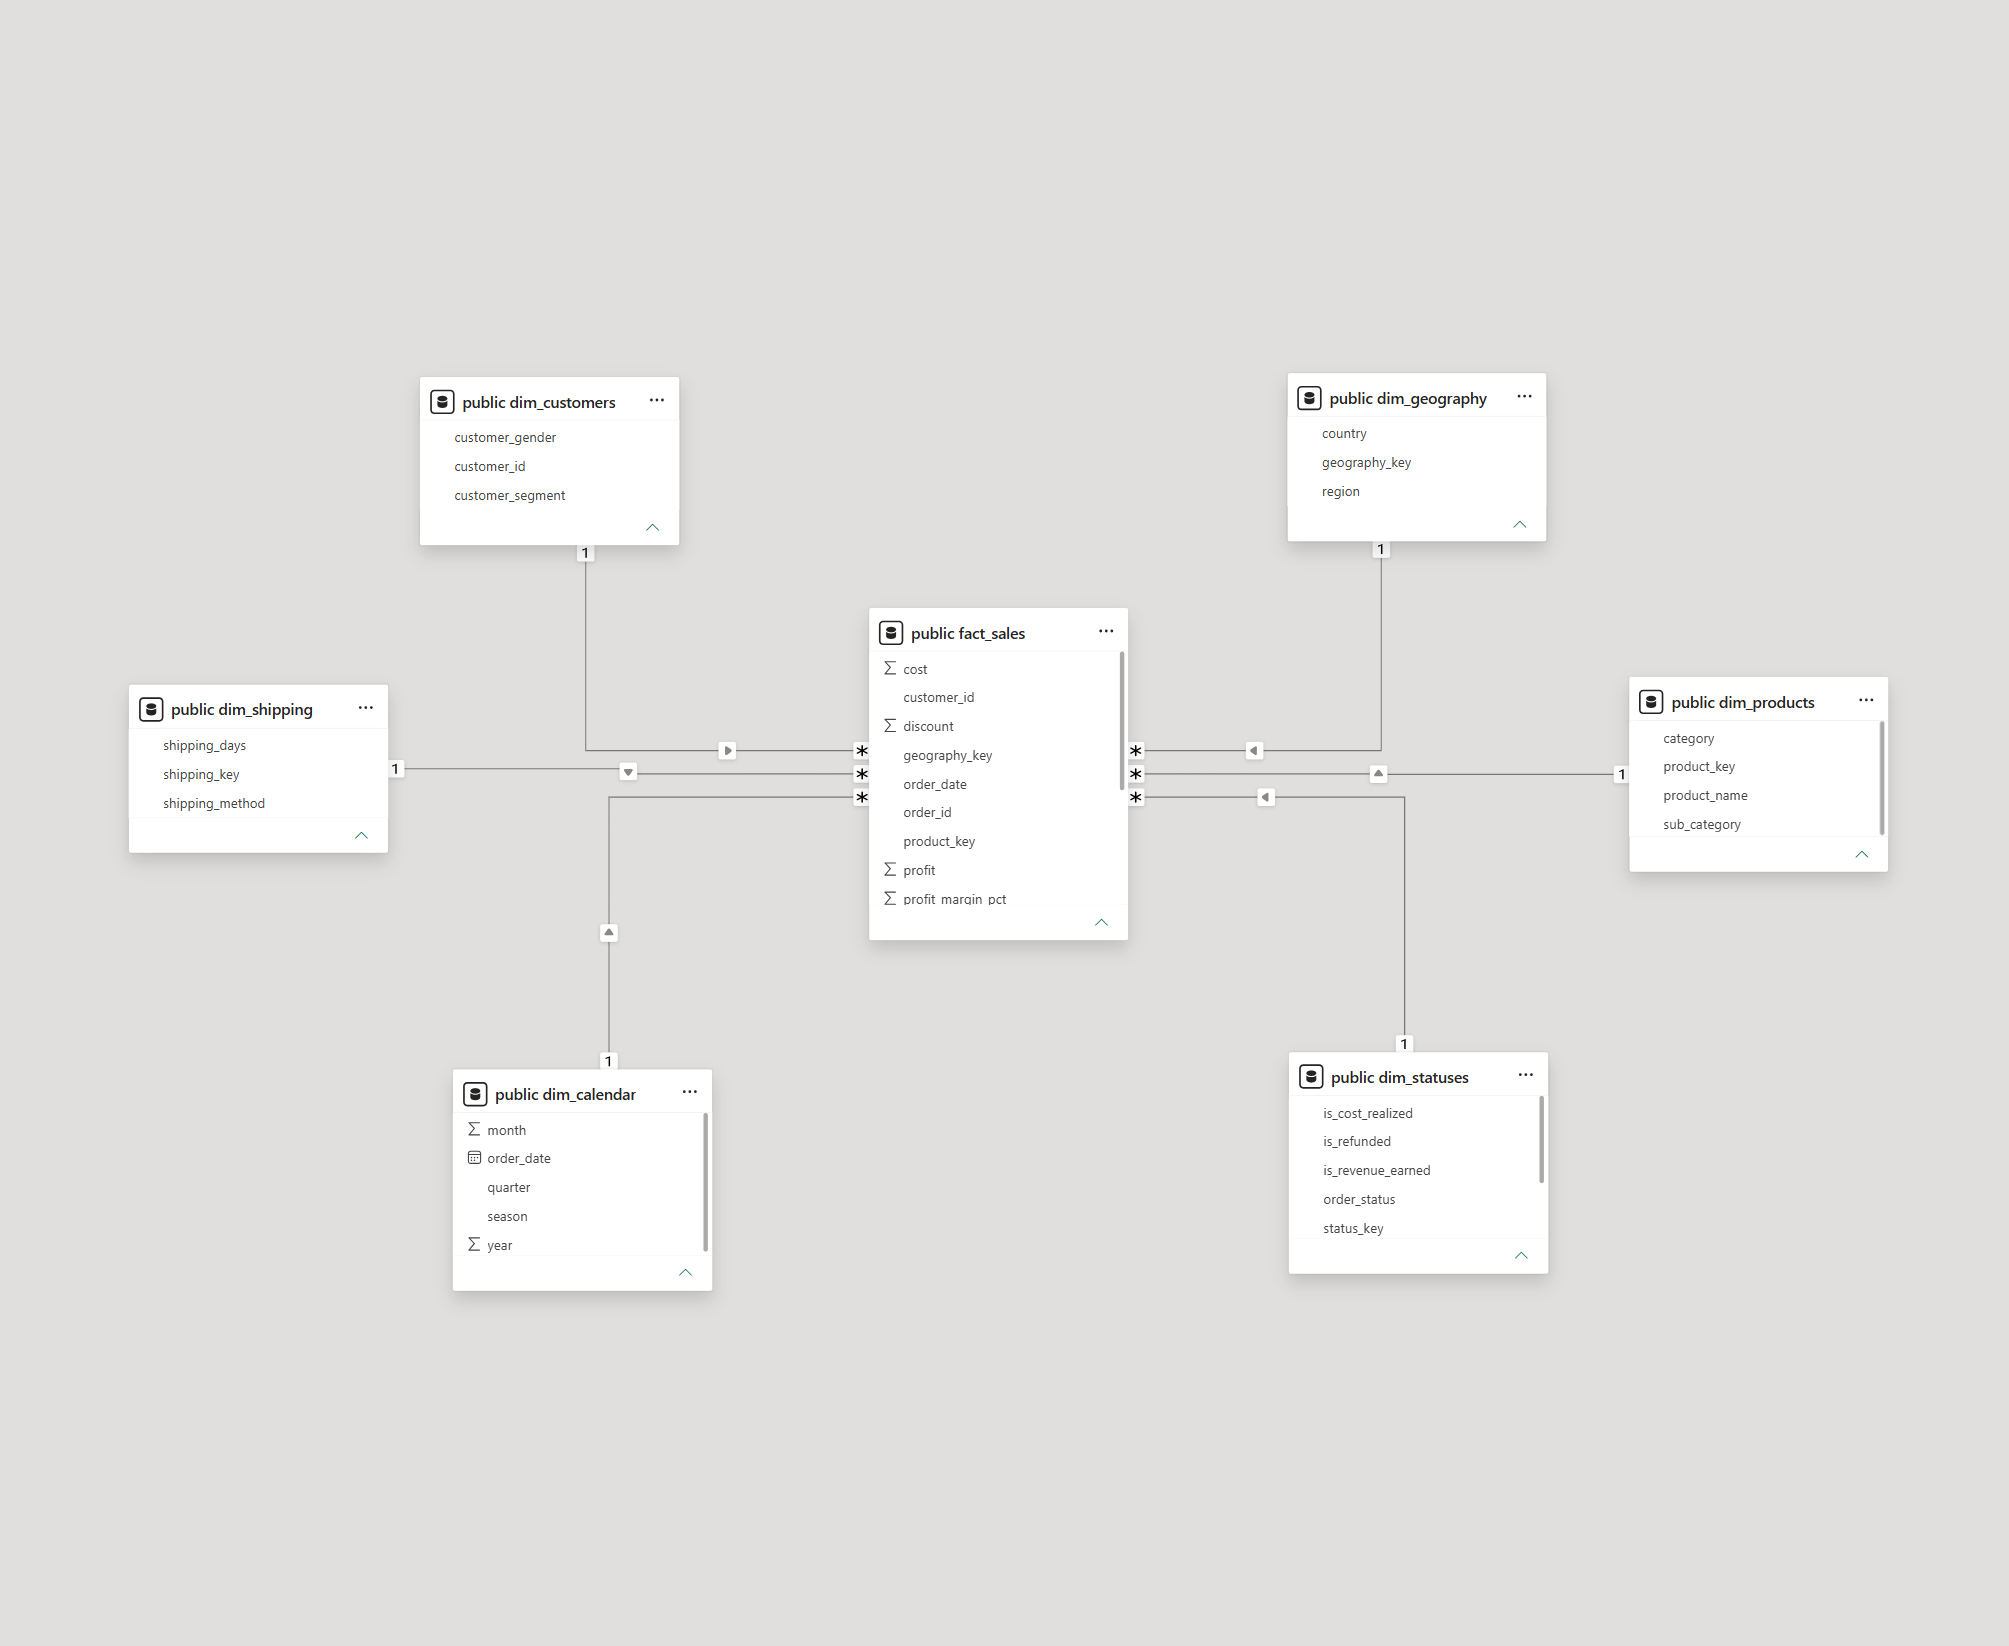
Database & Modeling (PostgreSQL): Loaded the cleaned data into Postgres and designed a structured Star Schema (Fact and Dimension tables). Authored SQL scripts to update records and maintained strict database relationships, successfully handling data integrity issues like case-sensitivity. Python and SQL code can be seen on my GitHub page here.
Visualization & Analysis (Power BI): Connected Power BI directly to the Postgres database. Wrote DAX measures to calculate key business metrics (like Clean Profit Margin % and Revenue Leakage) and designed a cohesive, 5-page interactive and cross-filtering dashboard covering executive summaries, product and regional deep-dives, trends, and risk audits.
Buissness Insights
1) The Shipping Bottleneck & Revenue Leakage
Analysis reveals a large revenue leakage of 47.2% ($2.87M) to cancellations and returns across all orders. Interestingly, the two biggest money losers are the cheapest shipping option (Economy) and the most expensive option (Overnight).While the data doesn't explicitly tell us why customers are canceling, these two extremes point to two different customer friction points:
Economy ($0.79M lost): The high loss rate here likely correlates with long transit windows, where customers likely cancel due to delivery delays or extended waiting periods.
Overnight ($0.76M lost): Overnight shipping requires highly accelerated fulfillment, a high failure rate in this premium tier typically suggests a breakdown in order accuracy or transit quality control.
Potential Solutions:
Audit customer feedback and introduce notifications:
Review the specific return and cancellation reason codes for Economy orders. In the meantime, implementing automated tracking updates could help keep waiting customers informed and reduce preemptive cancellations.
Review Premium Order Accuracy:
Partner with the operations team to cross-reference overnight cancellations against order accuracy metrics. Impliment a nessecary buffer time period to ensure premium orders are verified properly before shipment
2) Product profitability strategy
While Electronics drive the highest sales volume and look great on a basic revenue chart, they carry low profit margins (~20% for items like Laptops). In contrast, Clothing/Women's Wear has lower sales volume but boasts a massive 37.3% profit margin.
Potential Shift:
Reallocate Marketing Budget: Shift 15–20% of the digital ad spend away from low-margin Electronics and reinvest it into high-margin clothing subcategories. This instantly boosts the company's bottom-line net profit without requiring them to acquire entirely new customers.
3) The Regional Margin Drop
The logistics bottleneck explains why Germany’s profit margins are lagging at 17.4% compared to the 23.2% global average. The data proves the business doesn't have a product-popularity problem in Germany; it has a local fulfillment and carrier problem.
Potential Solution:
Carrier Renegotiation: Review and potentially replace the regional third-party logistics (3PL) partners currently handling German deliveries, swapping them for carriers with better local tracking and localized distribution hubs.

Personal Development
This project completely changed how I view data analytics by showing me how important a proper, interconnected data pipeline is. The biggest thing I learned was how to design a structured star schema and write precise SQL joins to connect my fact table with key business dimensions.